Which Data May Drive Which Update

Dive into Deep Learning · §15.6

Which data may drive which update
one symbol flips the rule · offline severs the loop · overestimation measured against the optimum · the bonus becomes a penalty

The Rule

Every update estimates something; the estimand sets the data rule.

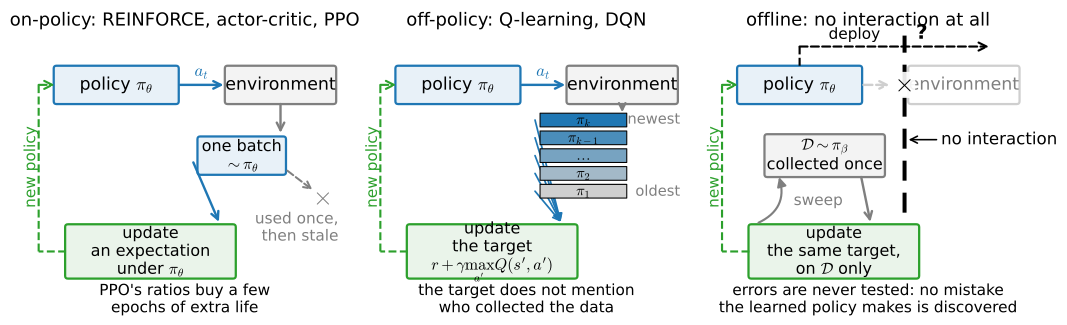
  • On-policy: an expectation under the current policy. Fresh data only; importance ratios buy a bounded extension (PPO’s epochs, V-trace’s actor lag).
  • Off-policy: the target r + \gamma \max_{a'} Q(s', a') mentions no collector. Any real transition is valid; replay is this license at scale.
SARSA: One Symbol, the Opposite Rule

\delta_{\textrm{SARSA}} = r + \gamma\, Q(s', a') - Q(s, a)

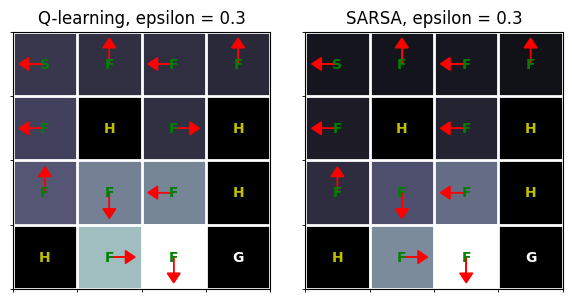
Bootstrap on the action actually taken: the fixed point becomes Q^{\pi_e}, the behavior’s value, exploration and all. On-policy.
def td_control(seed, env, num_episodes, epsilon, on_policy):
    """Q-learning and SARSA in one loop: they differ in a single symbol."""
    rng = np.random.default_rng(seed)
    Q, visits = np.zeros((16, 4)), np.zeros((16, 4))
    env.reset(seed=seed)
    for _ in range(num_episodes):
        s, done = env.reset()[0], False
        a = d2l.epsilon_greedy(Q[s], epsilon, rng)
        while not done:
            s2, r, terminated, truncated, _ = env.step(a)
            a2 = d2l.epsilon_greedy(Q[s2], epsilon, rng)
            target = Q[s2, a2] if on_policy else Q[s2].max()  # the symbol
            visits[s, a] += 1
            Q[s, a] += (r + gamma * (1 - terminated) * target
                        - Q[s, a]) / (1 + 0.1 * visits[s, a])
            s, a, done = s2, a2, terminated or truncated
    return Q

Q_q = td_control(0, env, 8000, epsilon, on_policy=False)
Q_sarsa = td_control(0, env, 8000, epsilon, on_policy=True)
d2l.show_grid(env.unwrapped.desc, np.stack([Q_q.max(-1), Q_sarsa.max(-1)]),
              np.stack([Q_q.argmax(-1), Q_sarsa.argmax(-1)]),
              titles=['Q-learning, epsilon = 0.3', 'SARSA, epsilon = 0.3'])

Two Tables, Two Questions

Q-learning: greedy policy succeeds 72.5%; the behavior earns 0.061
            the policy-weighted table value sum_a pi(a|s0) Q(s0, a) claims 0.180
     SARSA: greedy policy succeeds 74.1%; the behavior earns 0.070
            the policy-weighted table value sum_a pi(a|s0) Q(s0, a) claims 0.061
  • Q-learning claims 0.182 at the start: that is V^* = 0.180, the value of a policy it never ran. Its own behavior earns a third of it.
  • SARSA’s table, read policy-weighted as \sum_a \pi_e(a \mid s_0)\, Q(s_0, a), claims 0.061 against the 0.070 its behavior earns. The \epsilon tax is priced into every entry.
  • Same arrows, within noise; different reference.

Offline: No Second Chances

Fixed dataset, no interaction. Improving on the behavior means answering counterfactual queries, and the learned policy prefers exactly the actions whose values are inflated: consulted where least trained (distribution shift).

Self-correction is severed: an inflated value is never tested. And the max hunts the upward errors, the way any optimizer probes a model for its soft spots.

Distribution Shift, Measured

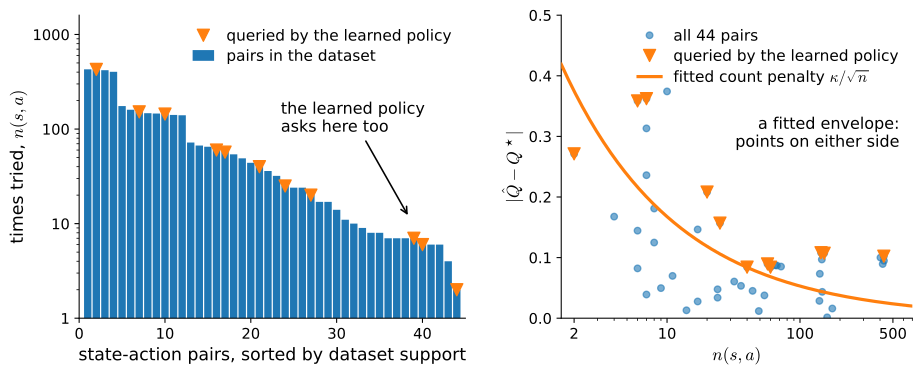
The greedy policy asks deep in the thin tail. The fitted count penalty \kappa/\sqrt{n} is a descriptive envelope through the error cloud, with a floor the counts cannot explain, not a law.

Three Arms, Fifteen Datasets

Naive offline Q-learning, its pessimistic variant at \kappa = 0.1, and the behavior clone of :numref:sec_imitation, each judged on promise and delivery.

      naive: predicted median 0.274, spread 0.185 to 0.388
             actual    median 0.097, spread 0.070 to 0.184
pessimistic: predicted median 0.121, spread 0.035 to 0.225
             actual    median 0.080, spread 0.050 to 0.189
      clone: predicted median 0.007, spread 0.004 to 0.014
             actual    median 0.008, spread 0.003 to 0.014
promises above V*(s0): naive on 15 of 15 datasets, pessimistic on 2 of 15
pessimism delivered the better policy on 4 of 15 datasets

Caught Red-Handed, Then Repaired

  • Naive: median promise 0.274, above the optimum 0.180 on all fifteen datasets; median delivery 0.097. Close to a threefold lie.
  • Pessimistic: median promise 0.121; calibrated on all but two datasets. The policy is no better (ahead on only 4 of 15).
  • Clone: promises 0.007, delivers 0.008. Calibrated, and worthless.

Pessimism buys a roughly trustworthy promise, not a better policy; the naive method beats the clone tenfold: the dataset knew more than its collector used.

The Sign, Completed

Online, an optimistic error summons the data that convicts it. Offline, it is never tested: the safe direction of error is down.

\textrm{UCB: } \hat{\mu} + \kappa\sqrt{\log t / n} \qquad \textrm{offline: } \hat{Q} - \kappa/\sqrt{n}

One count-shrinking radius, two signs; the sign is set by whether the loop is open. The \log t stays online: it revives idle arms, and offline nothing idles.

Beyond the Gridworld

  • Constrain the policy: BCQ, actions the data supports; the tabular form changed nothing here (zero init is already the floor; the disease is thin support, not absent support).
  • Constrain the values: CQL pushes down out-of-data actions; IQL never queries them; TD3+BC just adds a cloning term.
  • Drop the bootstrap: Decision Transformer conditions a sequence model on desired return. No max, no inflation; how much the transformer adds is an open argument.
  • Model selection without a simulator: the setting’s open sore.

Recap

  • The estimand sets the data rule; SARSA vs Q-learning is one symbol.
  • Offline = off-policy at its limit, minus self-correction.
  • Naive promise beat the computable optimum on 15 of 15 datasets; delivery was a third of promise.
  • The clone is the mandatory baseline: calibrated and weak here.
  • a count-shrinking radius: added online (UCB, with its \log t), subtracted offline as \kappa/\sqrt{n}; the sign is set by whether the loop is open.
  • At scale: constrain policy or values, or model sequences instead.